Debugging with Chrome
Even though JavaScript is a very popular programming language, used by millions of websites, there aren’t actually that many great tools for debugging software written in JavaScript. Google Chrome however, does have some built-in developer tools that we will find very useful during this course.
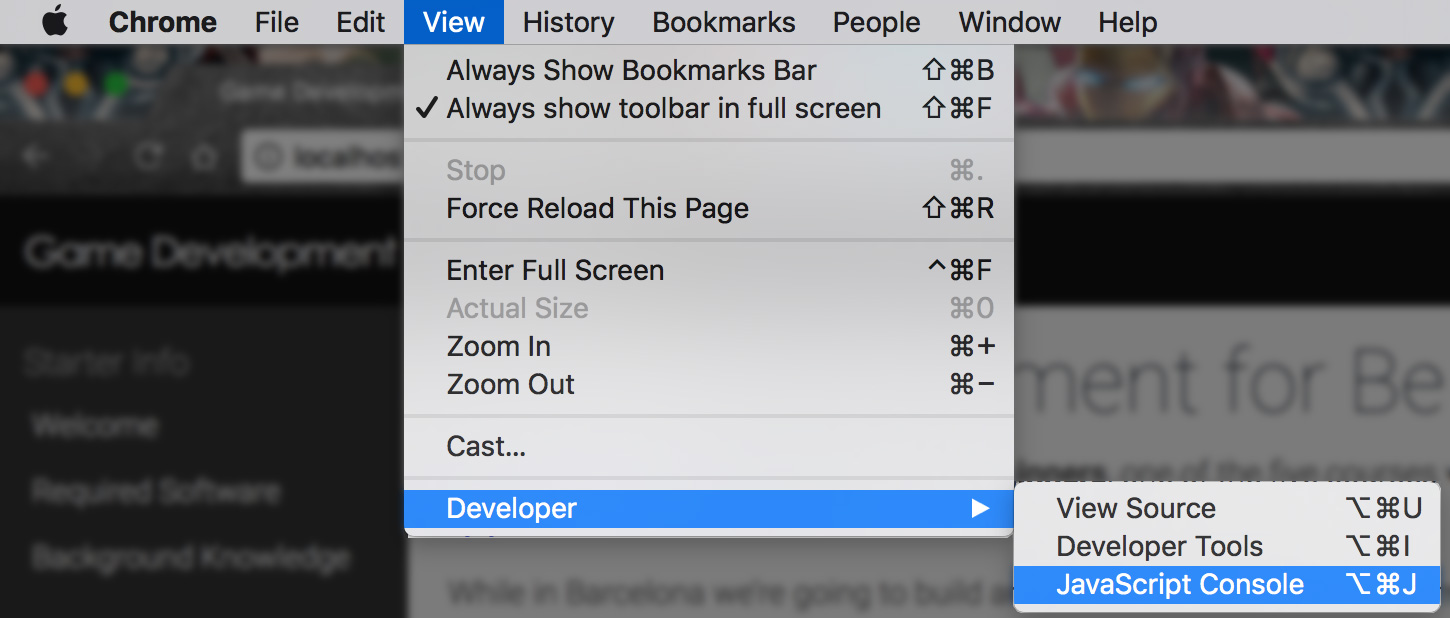
Access the Chrome JavaScript developer tools from the main menu at ‘View’ -> ‘Developer’ -> ‘JavaScript Console’.
There are two main tools that Chrome offers for JavaScript debugging…
JavaScript Console
The JavaScript Console is a convenient place to read all of the console.log(); messages that are printing out from your application. console.log(); is a convenient way to print out debug information while your game is running. If you’re having problems figuring out why something isn’t appearing on screen for instance, you might print out it’s position to make sure it’s not outside of the camera.
The JavaScript console will also print any errors that have occured in your script. Whether you have made a simple syntax error and missed a character (like a ‘}’) or whether you’ve tried to access a variable and it doesn’t exist - the console will print out those errors and often give you a good hint as to which line in your script the error occured.
Last but not least, the JavaScript console allows you to type and run JavaScript live while your game is running. Maybe you want to print out the value of some variables or resize your game window without loading the page - you can tweak these values in the console.
As the console also lets you change variables live while the game is running - it's really good where possible to make gameplay constants like the speed of the player ship into a variable. It's all too easy to take short-cuts and write raw numbers straight into your code, but by making these values into variables you can change them while your game is running - which is pretty cool! It's super valuable when making games to be able to edit gameplay values as quickly as possible - as much of making a game good involves tweaking variables over and over until something feels right!
JavaScript Breakpoints
Another incredibly useful tool that Google Chrome offers for debugging JavaScript is Breakpoints. As you know, JavaScript runs one statment at a time - i.e. one after the other. While they usually run incredibly fast, breakpoints allow you to stop the code whenever your application reaches a certain line of your source code. From this state, you can step over each statement in your code one at a time - running just one command for each step. This allows you to visualise the flow your application is taking through if statements (does your code end up in the correct branch?). You can also see the values in your variables after each step - so you can check that the values are what you expect (and if they are not - you can try to figure out why)!
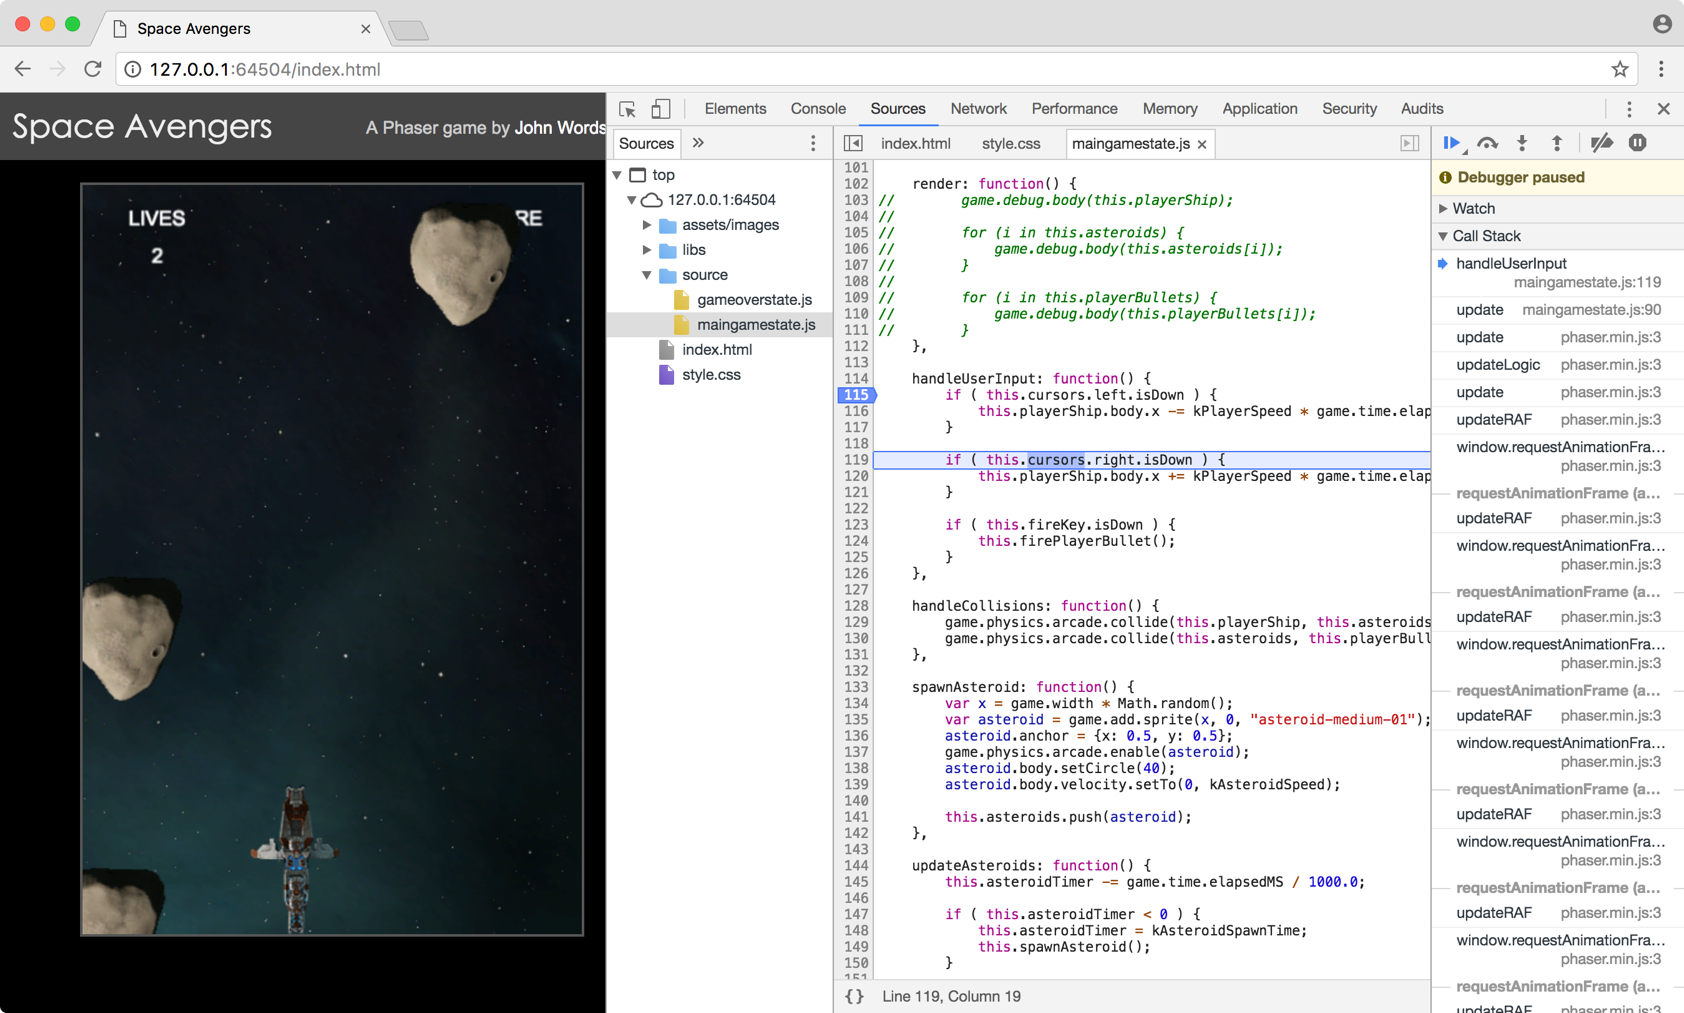
In order to set a breakpoint in one of your scripts, you need to go to a different tab in the Developer Tools. If you already have the developer console active, you should click on the ‘sources’ tab in the developer tool. The ‘sources’ tab shows you all of the elements that the browser has downloaded when building your webpage.
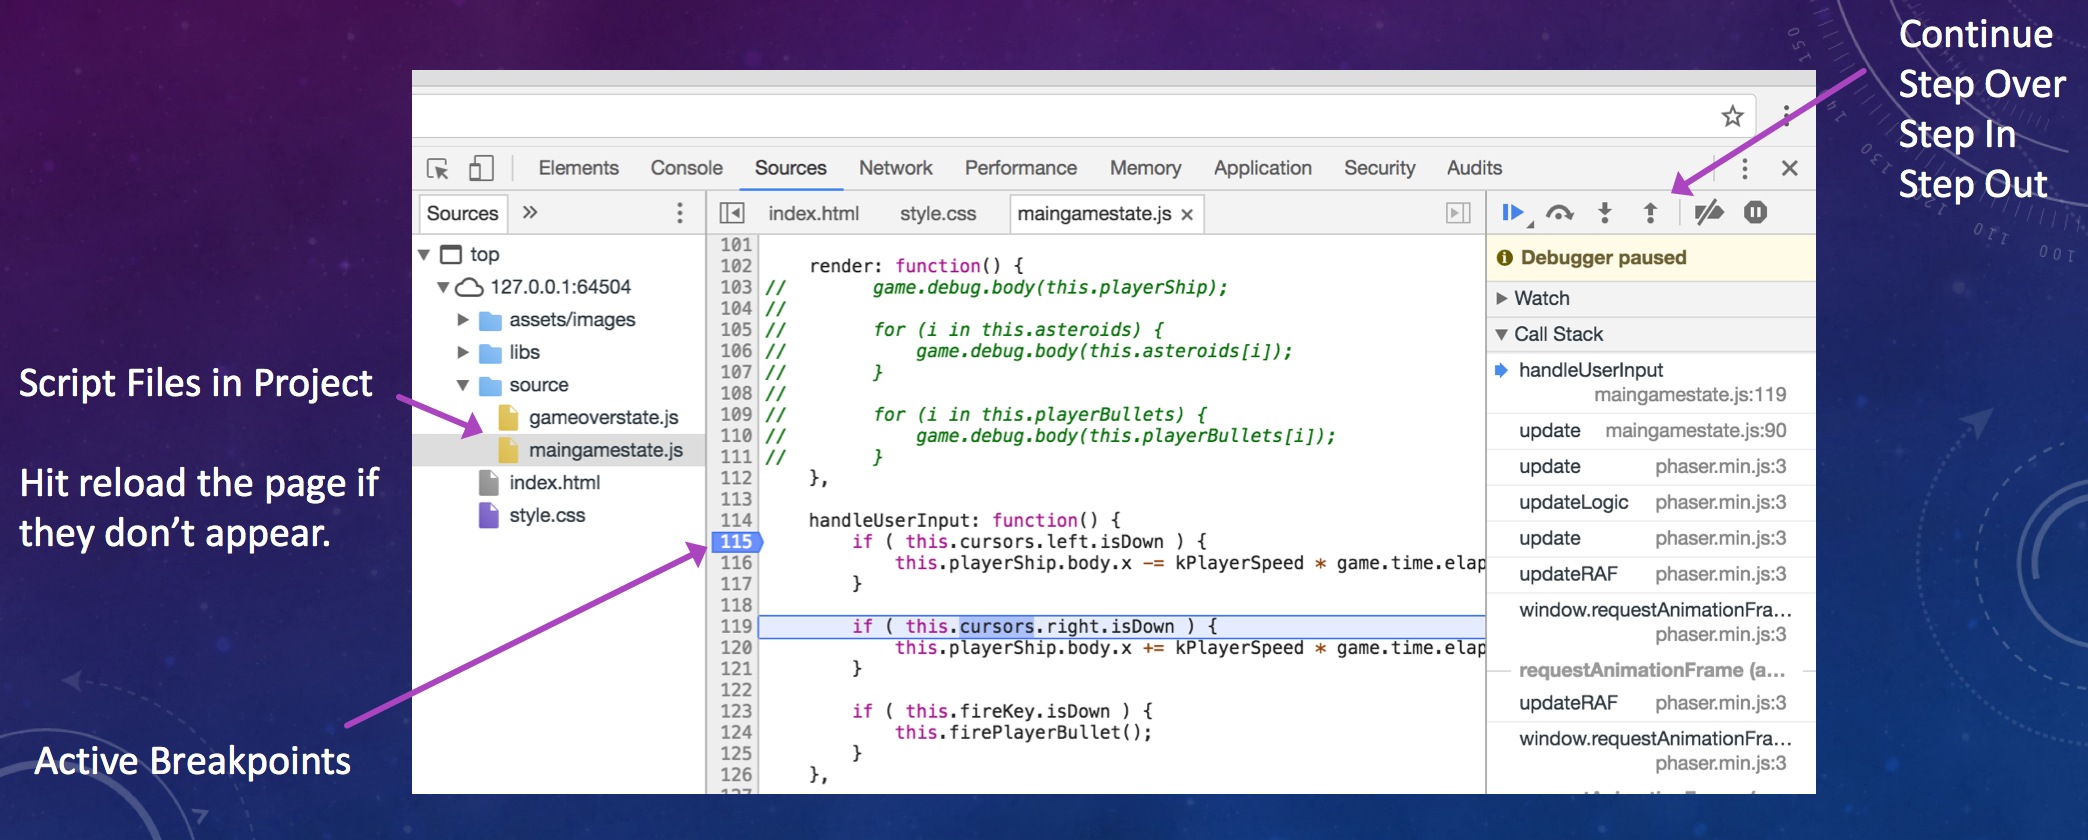
From the list of files down the side, you should be able to locate the JavaScript files that make up your game. From here, you can open any of these script files and see the code you’ve written in Brackets. From here, you can click on the line number on the grey bar to the left of your source code and a blue arrow should appear next to that line of code. That’s all it takes to set a break point! The next time your application reaches this line of code - everything will completely stop and you’ll be able to see the value of variables in your code and step through your code one line at a time.
Note. If your game is already running, you might need to refresh the page in order to hit your new breakpoint. For instance, if you have set a breakpoint in the setup code for your game - your application likely only runs this code once when your game starts and then it never runs it again.
While your application has stopped due to a breakpoint, you can see the following values (shown in the screenshot above);
-
Step / Resume Buttons: At the top of the right hand panel next to your code, you should see a row of 4 useful buttons. The first button simply resumes your application running as normal (until it hits the next breakpoint that is). The next three buttons allow you to step through your code in slightly different ways. The ‘step over’ button will go over the next line of code. If that line of code contains a function call, it will do that whole function call before stopping the code again. The next button is slightly different and will ‘step into’ a function if one exists on the line you’re stepping through. The last button ‘steps out’ of the current function, running all of the lines in the current function right until the end before stopping again.
-
Variable Inspection: When your code has stopped in a breakpoint you’re able to place your mouse over many variables in your source code and see their current value. This is incredibly useful as it allows you to ensure that everything as you expect it should be.
-
Call Stack: The call stack shows you which function your code is currently in and which function(s) called the current function. Whenever you call a function in JavaScript, the control flow enters that new function but the application needs to remember where to return to when that function ends. As you can imagine, you can end up quite deep with funtions calling functions calling functions. The call stack shows you exactly how the application ended up running this line of code - whether it was loading an image from start-up or loading it later in the game.
-
Scope: The scope panel provides a more ordered way to look at the values of variables in your program. The “local scope” lists all variables that exist in the current function. It’s usually a short list of variables but nearly always the ones that you are working with at the moment. The scope panel allows you to see all of these variables all in one place.
-
Watch: The watch panel allows you to keep an eye on certain variables over time. It’s a lot more tidy than constantly printing values out using console.log and it allows you to watch certain numbers (perhaps the player’s score) before you’ve added UI to the game to show those values.